How Mouse Movement Analysis Accurately Differentiates Bots From Humans
How Mouse Movement Analysis Accurately Differentiates Bots From Humans
How Mouse Movement Analysis Accurately Differentiates Bots From Humans
Advancements in technology and the rise of intelligent, human-like bots has rendered traditional detection techniques redundant. Businesses can use mouse.
Author
Priyadarsh Singh


See how Bureau has helped industry leaders defend against networked Industrial-scale frauds →
Schedule a Demo
TABLE OF CONTENTS
See Less
Maintaining user authenticity and platform integrity, in the backdrop of rapid digitalization, makes it critical for businesses to proactively detect automated agents and bots. This widening gap between bot sophistication and traditional defense mechanisms means digital businesses are at a greater risk of fraudulent account creation, account takeover, data scraping, and several other forms of automated abuse.
Mouse movement behavior offers a stronger and harder-to-spoof signal in bot detection, as it captures subtle motor patterns that are difficult for bots to mimic authentically. Tracking and analyzing subtle patterns, such as variations in speed, angular changes, path, and pauses, among others, can help identify bots that can even mimic clicks or cursor patterns.
The analysis below demonstrates how raw mouse movement behavior data can be transformed into engineering features and visual patterns to reliably identify use of automation.
Methodology
To demonstrate that mouse movement data can be used as a viable detection mechanism for automation, the open-source dataset: DELBOT-Mouse was examined. This dataset contains labeled mouse movement sessions from both humans and bots, recorded across different screen resolutions.
Steps taken
Step | Area | Activity |
Step 1 | Data Ingestion and Preprocessing |
|
Step 2 | Feature Engineering |
|
Step 3 | Visualisation and Pattern Analysis |
|
This activity helped identify consistent patterns that can be used to differentiate bots from humans. These include:
Bots show more linear, repetitive, high-efficiency movement.
Humans tend to hover, hesitate, and take indirect paths.
Timing and speed also show significant behavioural divergence.
Insights
The insights from the activity as enumerated below collectively validate that mouse behavior is a robust signal for distinguishing bots and is especially useful in passive behavioral bot detection systems.
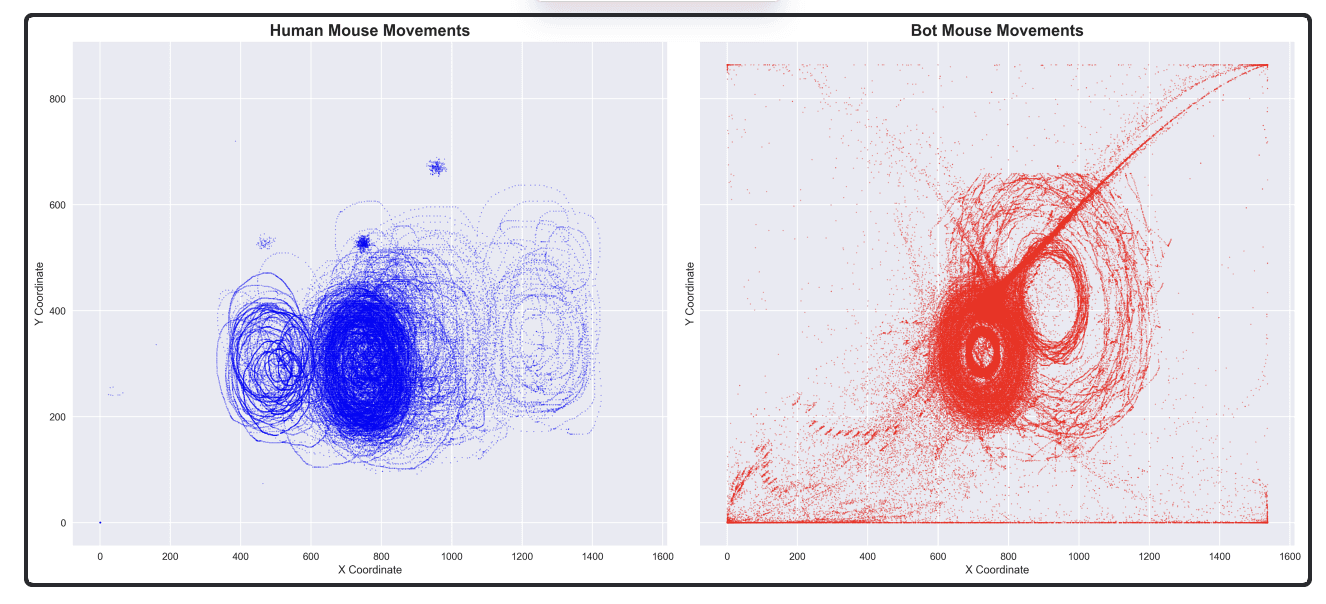
1. Raw Mouse Movement Scatter Plots
Shows the overall spatial pattern of mouse movements using (x, y) points for each group.
Human: Movements appear organic, dense near central activity zones, and circular/elliptical paths — suggesting hesitation, hovering, or exploration.
Bot: Exhibits sharp, linear, or geometric patterns; noticeable convergence points (e.g., spiral center), and dense activity along straight paths — indicative of scripted or programmed behavior.
2. Heatmap
Highlights where the mouse spends most of its time.
Human: Broader, more diffused heat concentration, especially around the center of the screen; diverse movement coverage.
Bot: Tightly focused hotspots, often in corners and along straight lines — suggesting repetitive, targeted movements.

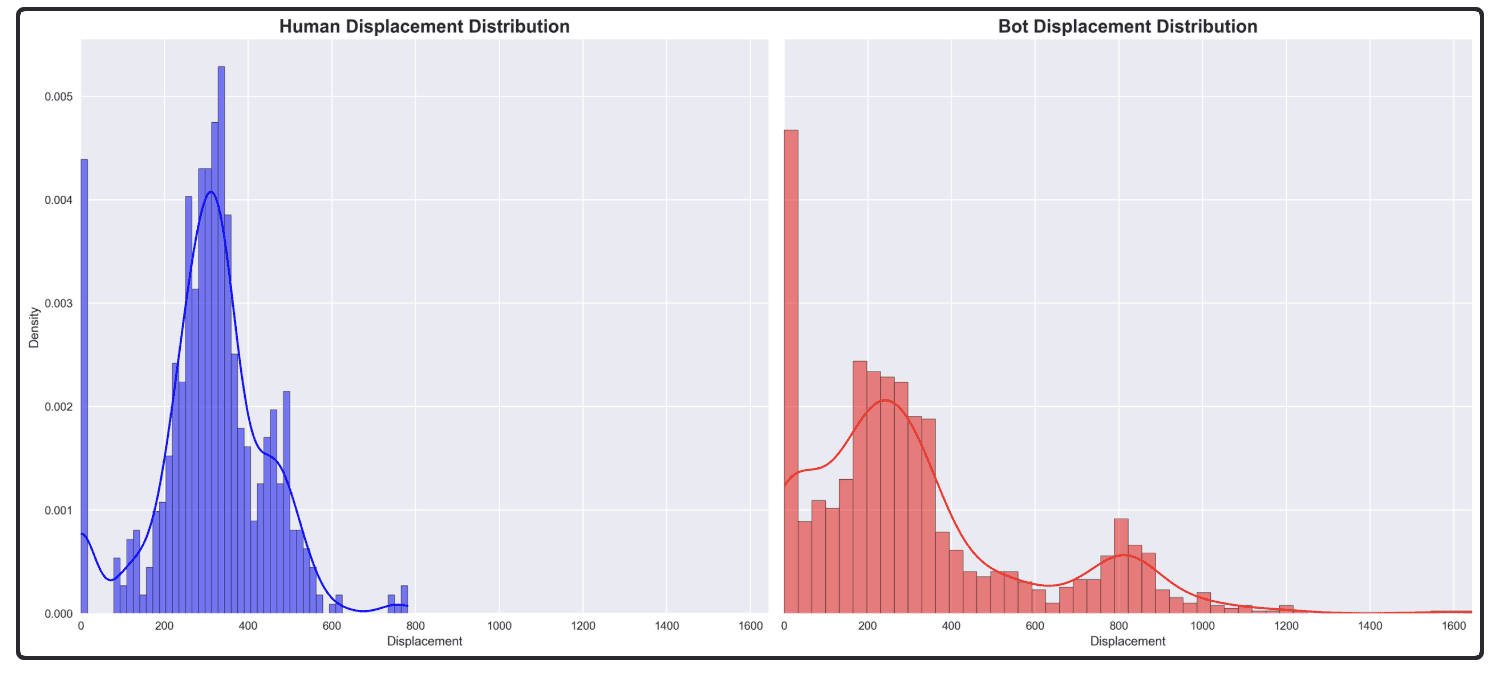
3. Displacement Distribution
Measures the straight-line distance from the start to end of a session.
Human: Gaussian-like curve centered around 300–400 pixels, indicating moderate, consistent movement lengths.
Bot: Bimodal distribution — one peak at very low displacement (micro-adjustments), and another at higher displacements (>800 pixels), suggesting abrupt jumps.
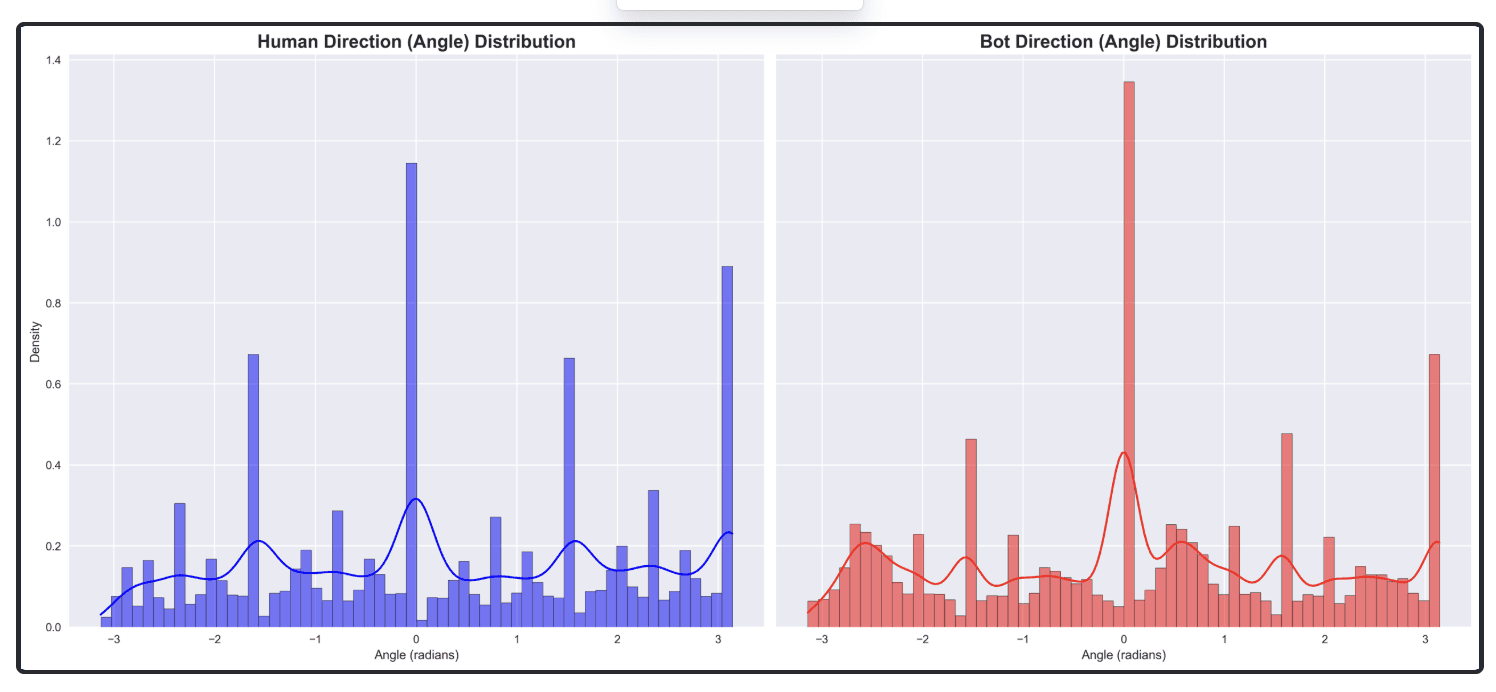
4. Direction (Angle) Distribution
Represents the angle/direction of movement at each step.
Human: Wide, nearly uniform distribution; minor peaks suggest natural directional bias.
Bot: Sharp peaks at fixed angles (0, ±p/2, ±p), showing rigid up/down/left/right patterns typical of automation.
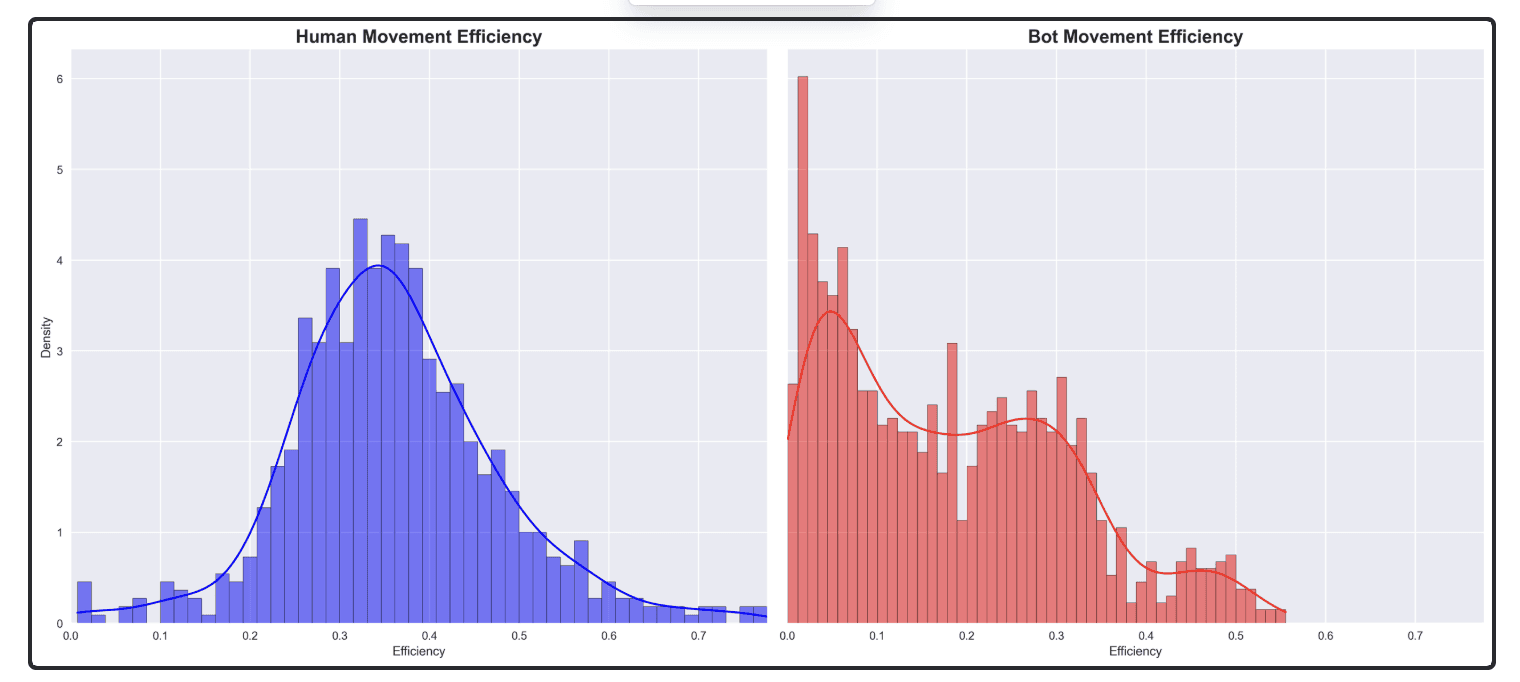
5. Movement Efficiency
Indicates how direct the path is from start to end. Using the formula: Efficiency = EuclideanDistance(start ? end) / TotalPathLength, it is deduced:
Human: Lower efficiency (peak around 0.3–0.4) implies more exploration and detours.
Bot: Higher efficiency (peaks ~0.05–0.2) suggests direct, optimised motion paths; sometimes randomised to appear human-like.
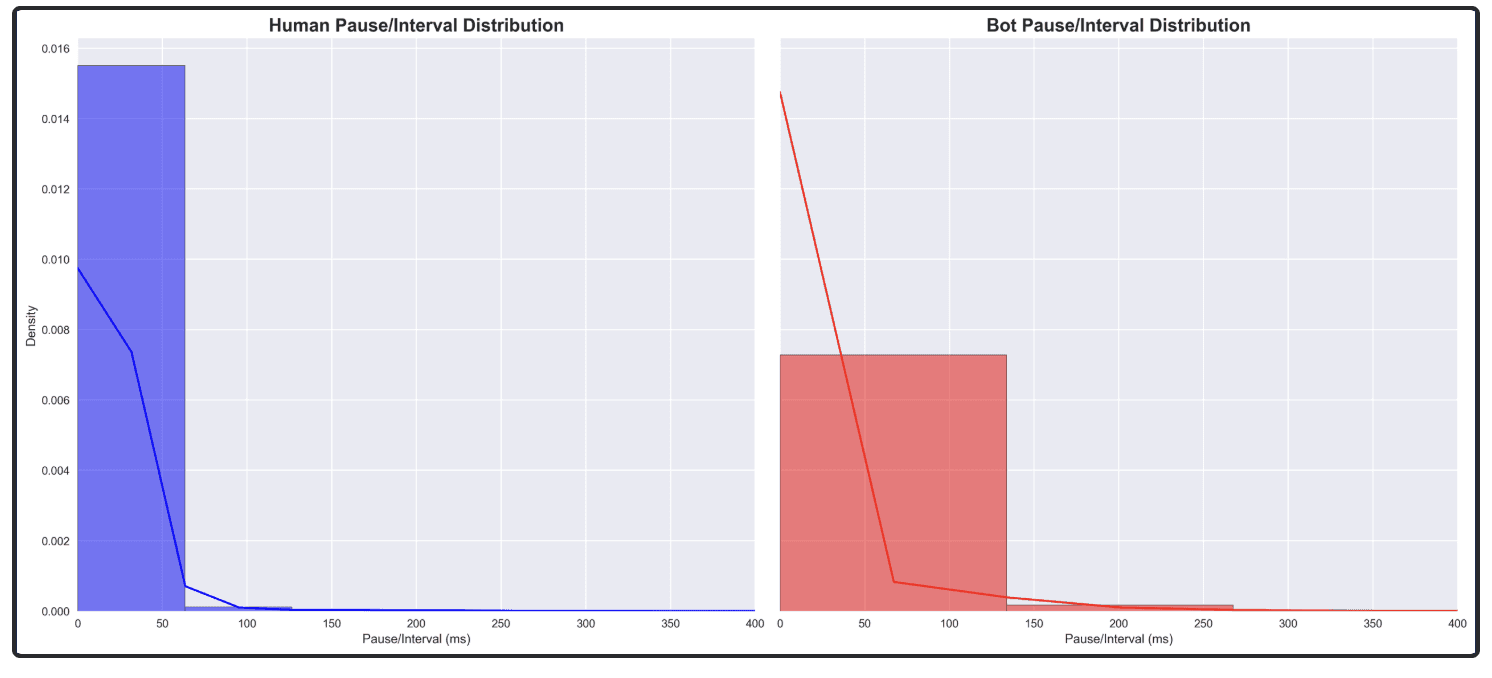
6. Pause/Interval Distribution
Time gaps between sequential mouse events.
Human: Wide range with irregular pauses and a long-tailed distribution.
Bot: Sharp initial drop with most pauses clustered in a narrow window — a telltale sign of automation.
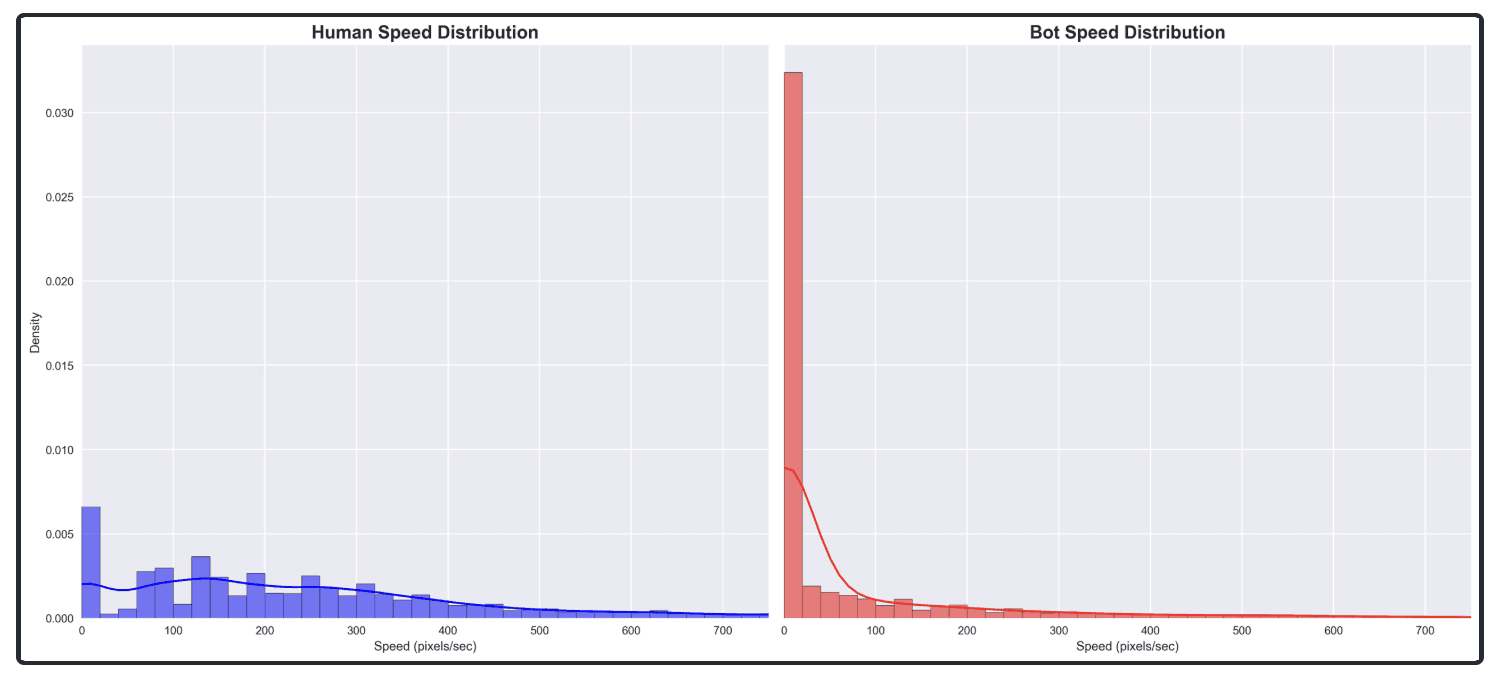
7. Speed Distribution
Rate of movement (pixels/sec) between consecutive points.
Human: Broad range with concentration at slower speeds, representing natural behaviors like hovering or adjusting.
Bot: Prominent low-speed spikes (to mimic human hesitation) along with sudden high-speed transitions — oscillating between idling and burst actions.
Conclusion
The visualisations and distributions confirm that mouse movement behavior is a robust, passive signal that can clearly separate human and bot behaviors across multiple metrics. Businesses can use behavioral bot detection systems and high-fidelity signals to improve their fraud prevention capabilities against automated fraud.
Even for intelligent bots with advanced human-like behaviors, behavioral patterns such as movement precision, path efficiency, and timing regularity can be detected with engineered features and visualization techniques.
—---
Reference: The dataset used for this analysis is sourced from : GitHub - chrisgdt/DELBOT-Mouse: A small deep-learning library to distinguish human and bot from their mouse movements.
It contains labeled mouse movement data collected from both human and bot users. The data is categorised by screen resolution that resemble the following devices: mac, laptop(windows), and monitor.
Notably, both mac and monitor datasets include samples from humans and bots, making them suitable for comparative behavioural analysis. These two sources were combined for the charts and insights presented below.
Each session consists of timestamped mouse coordinates and actions (e.g., Move, Press), which we used to compute derived features like displacement, speed, efficiency, angle, and pause intervals.
Maintaining user authenticity and platform integrity, in the backdrop of rapid digitalization, makes it critical for businesses to proactively detect automated agents and bots. This widening gap between bot sophistication and traditional defense mechanisms means digital businesses are at a greater risk of fraudulent account creation, account takeover, data scraping, and several other forms of automated abuse.
Mouse movement behavior offers a stronger and harder-to-spoof signal in bot detection, as it captures subtle motor patterns that are difficult for bots to mimic authentically. Tracking and analyzing subtle patterns, such as variations in speed, angular changes, path, and pauses, among others, can help identify bots that can even mimic clicks or cursor patterns.
The analysis below demonstrates how raw mouse movement behavior data can be transformed into engineering features and visual patterns to reliably identify use of automation.
Methodology
To demonstrate that mouse movement data can be used as a viable detection mechanism for automation, the open-source dataset: DELBOT-Mouse was examined. This dataset contains labeled mouse movement sessions from both humans and bots, recorded across different screen resolutions.
Steps taken
Step | Area | Activity |
Step 1 | Data Ingestion and Preprocessing |
|
Step 2 | Feature Engineering |
|
Step 3 | Visualisation and Pattern Analysis |
|
This activity helped identify consistent patterns that can be used to differentiate bots from humans. These include:
Bots show more linear, repetitive, high-efficiency movement.
Humans tend to hover, hesitate, and take indirect paths.
Timing and speed also show significant behavioural divergence.
Insights
The insights from the activity as enumerated below collectively validate that mouse behavior is a robust signal for distinguishing bots and is especially useful in passive behavioral bot detection systems.
1. Raw Mouse Movement Scatter Plots
Shows the overall spatial pattern of mouse movements using (x, y) points for each group.
Human: Movements appear organic, dense near central activity zones, and circular/elliptical paths — suggesting hesitation, hovering, or exploration.
Bot: Exhibits sharp, linear, or geometric patterns; noticeable convergence points (e.g., spiral center), and dense activity along straight paths — indicative of scripted or programmed behavior.
2. Heatmap
Highlights where the mouse spends most of its time.
Human: Broader, more diffused heat concentration, especially around the center of the screen; diverse movement coverage.
Bot: Tightly focused hotspots, often in corners and along straight lines — suggesting repetitive, targeted movements.
3. Displacement Distribution
Measures the straight-line distance from the start to end of a session.
Human: Gaussian-like curve centered around 300–400 pixels, indicating moderate, consistent movement lengths.
Bot: Bimodal distribution — one peak at very low displacement (micro-adjustments), and another at higher displacements (>800 pixels), suggesting abrupt jumps.
4. Direction (Angle) Distribution
Represents the angle/direction of movement at each step.
Human: Wide, nearly uniform distribution; minor peaks suggest natural directional bias.
Bot: Sharp peaks at fixed angles (0, ±p/2, ±p), showing rigid up/down/left/right patterns typical of automation.
5. Movement Efficiency
Indicates how direct the path is from start to end. Using the formula: Efficiency = EuclideanDistance(start ? end) / TotalPathLength, it is deduced:
Human: Lower efficiency (peak around 0.3–0.4) implies more exploration and detours.
Bot: Higher efficiency (peaks ~0.05–0.2) suggests direct, optimised motion paths; sometimes randomised to appear human-like.
6. Pause/Interval Distribution
Time gaps between sequential mouse events.
Human: Wide range with irregular pauses and a long-tailed distribution.
Bot: Sharp initial drop with most pauses clustered in a narrow window — a telltale sign of automation.
7. Speed Distribution
Rate of movement (pixels/sec) between consecutive points.
Human: Broad range with concentration at slower speeds, representing natural behaviors like hovering or adjusting.
Bot: Prominent low-speed spikes (to mimic human hesitation) along with sudden high-speed transitions — oscillating between idling and burst actions.
Conclusion
The visualisations and distributions confirm that mouse movement behavior is a robust, passive signal that can clearly separate human and bot behaviors across multiple metrics. Businesses can use behavioral bot detection systems and high-fidelity signals to improve their fraud prevention capabilities against automated fraud.
Even for intelligent bots with advanced human-like behaviors, behavioral patterns such as movement precision, path efficiency, and timing regularity can be detected with engineered features and visualization techniques.
—---
Reference: The dataset used for this analysis is sourced from : GitHub - chrisgdt/DELBOT-Mouse: A small deep-learning library to distinguish human and bot from their mouse movements.
It contains labeled mouse movement data collected from both human and bot users. The data is categorised by screen resolution that resemble the following devices: mac, laptop(windows), and monitor.
Notably, both mac and monitor datasets include samples from humans and bots, making them suitable for comparative behavioural analysis. These two sources were combined for the charts and insights presented below.
Each session consists of timestamped mouse coordinates and actions (e.g., Move, Press), which we used to compute derived features like displacement, speed, efficiency, angle, and pause intervals.
TABLE OF CONTENTS
See More
Recommended Blogs


Landing Page.
Simple, bold.
Sign Up
Download

Products
Solutions
Resources


© 2026 Bureau . All rights reserved.
Solutions
Industries
Resources
Company
Solutions
Industries
Resources
Company
© 2026 Bureau . All rights reserved.
Follow Us
Leave behind fragmented tools. Stop fraud rings, cut false declines, and deliver secure digital journeys at scale
Our Presence


Leave behind fragmented tools. Stop fraud rings, cut false declines, and deliver secure digital journeys at scale
Our Presence
© 2026 Bureau . All rights reserved.